Analytics
The GlamAR Analytics module provides detailed insights into how users interact with your AR try-on experiences.
It tracks credit usage, product interactions, platform distribution etc. helps you measure performance, optimize conversions, and refine your AR strategy.
Plans
The Plans tab provides an overview of your account-level usage across all GlamAR modules. It displays your available credits, total credits consumed, and a breakdown of usage between AR Try-On and Skin Analysis.
This section helps you monitor consumption, identify usage trends, and plan upgrades before reaching your limits.
Credit Usage
The Credit Usage section shows your combined credit consumption across both the PixelBin and GlamAR platforms.
Credits are deducted based on feature activity, whether by a new or returning user:
- 1 credit per virtual try-on view
- 5 credits per face scan for skin analysis
Your usage reflects the total credits consumed within your current billing cycle, helping you understand how each feature impacts your plan limits and renewal schedule.
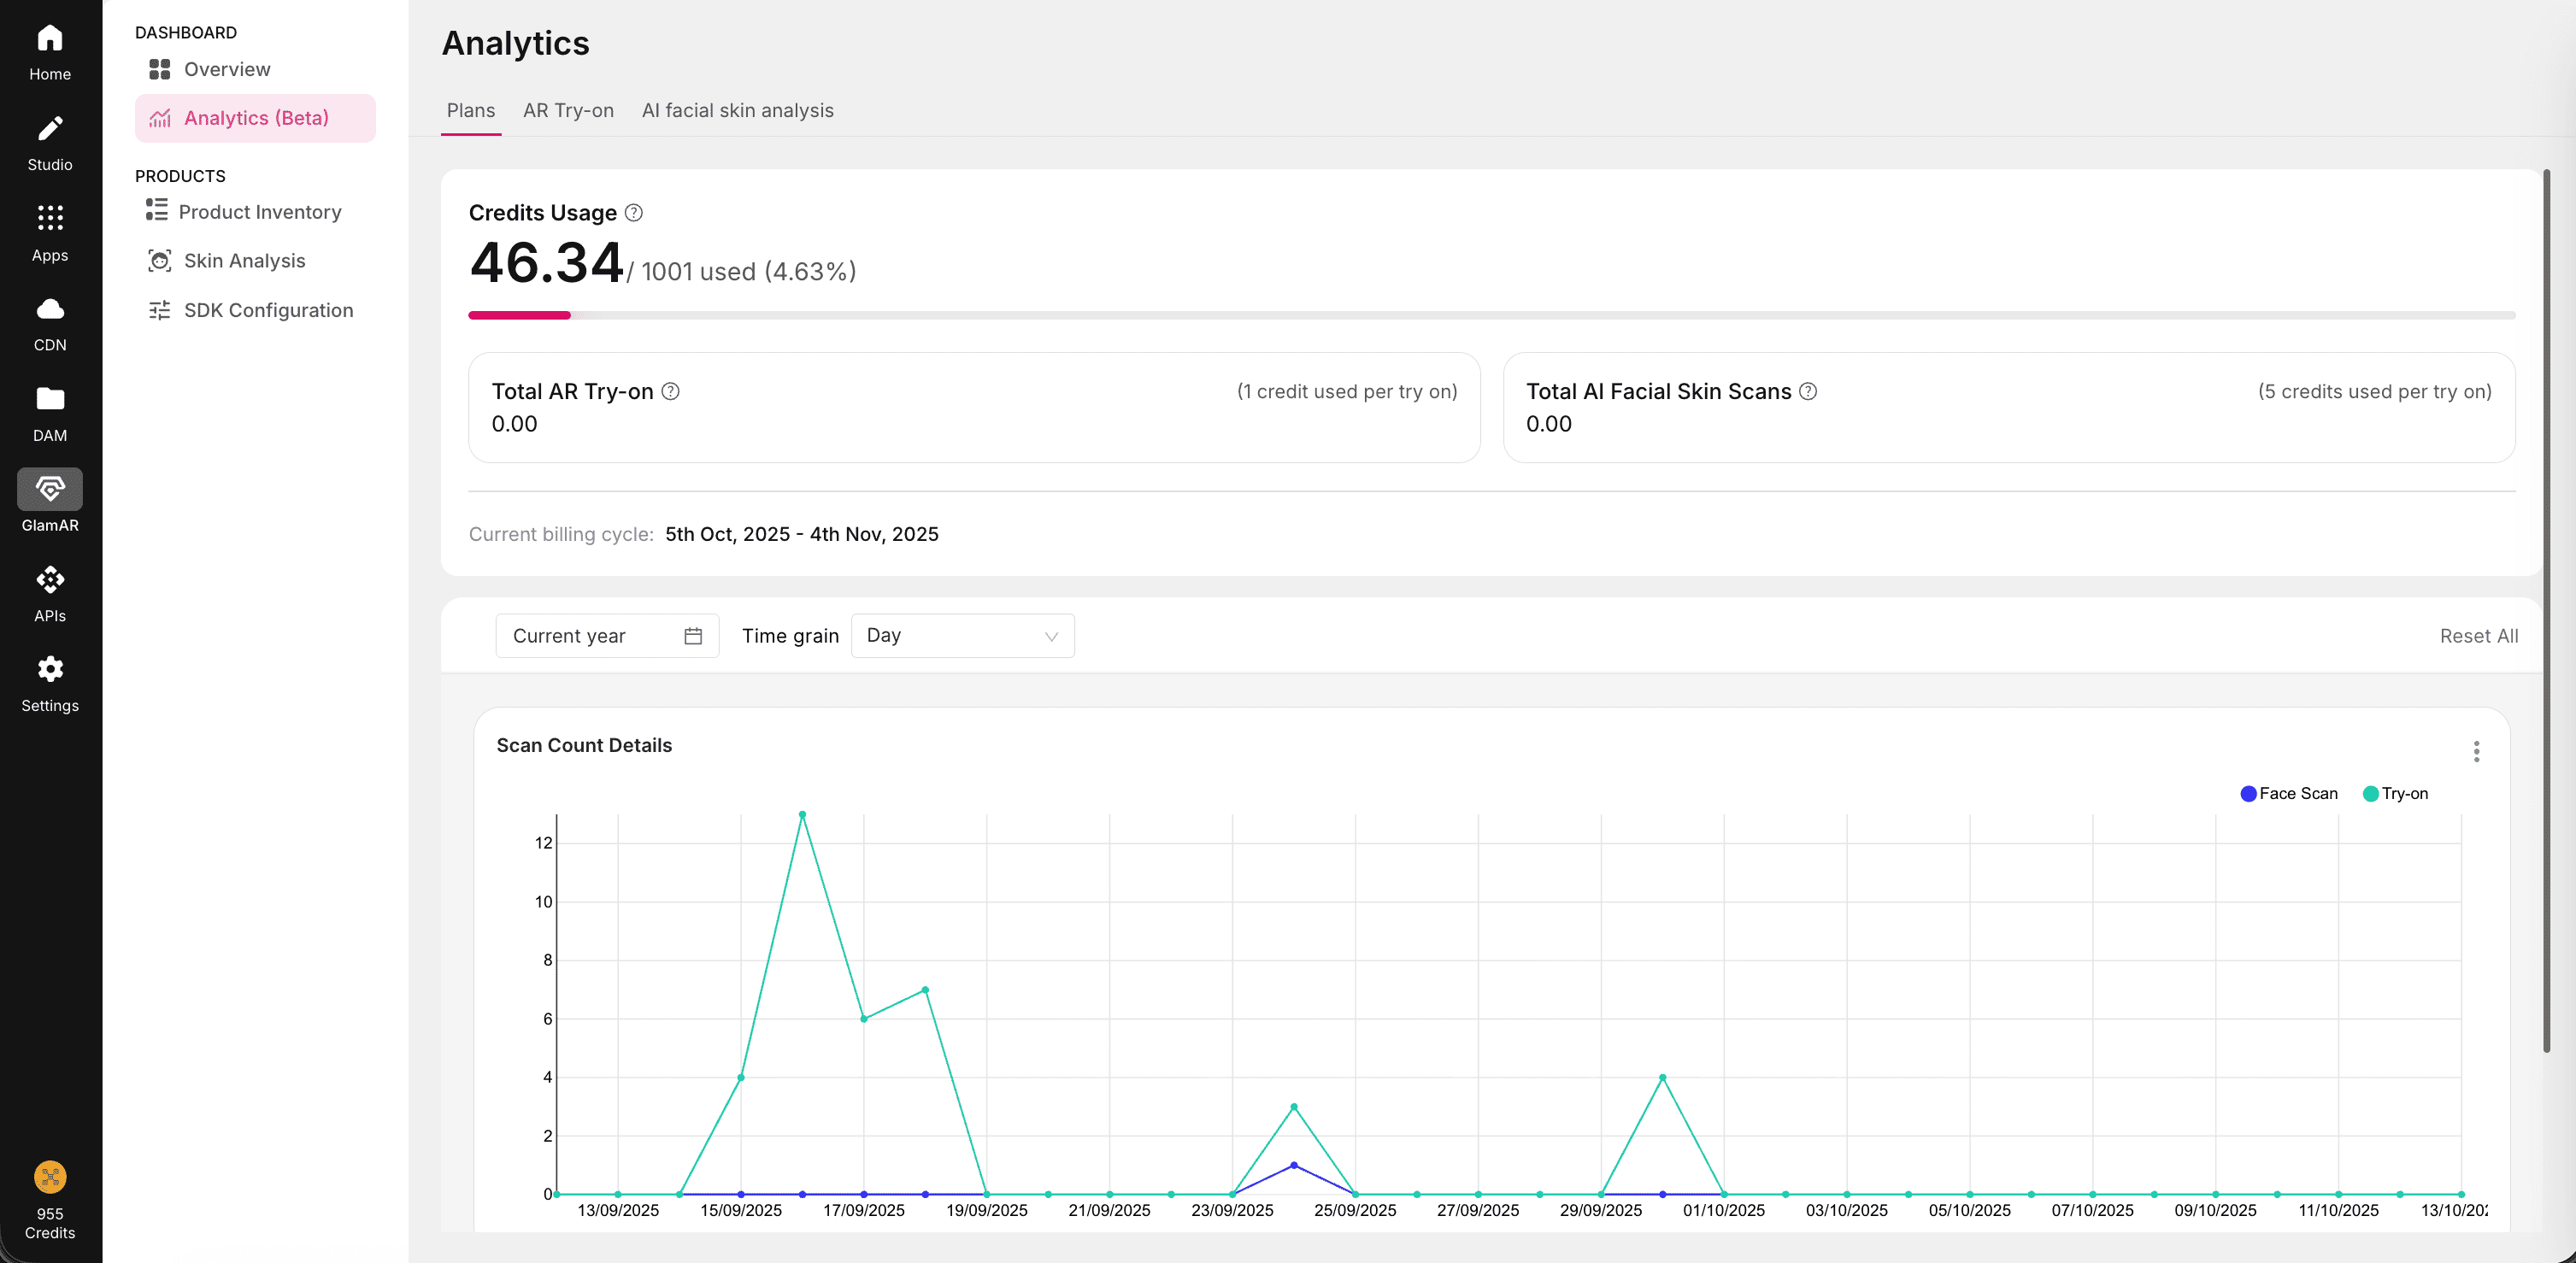
Usage Graph
Below the credit summary, the usage graph visualizes scan counts and overall activity for the selected period.
It helps you track how feature usage changes over time and identify performance patterns.
- Hover over a data point to view detailed counts.
- Toggle AR Try-On or Skin Analysis to focus on specific module activity.
- Adjust the time range or time grain to refine the graph’s view.
Time Range
You can view analytics for different time periods using the Time Range selector. Four range types are available:
| Range Type | Available Options |
|---|---|
| Current | Current Day, Current Week, Current Month, Current Quarter, Current Year |
| Last | Last 24 Hours, Last 7 Days, Last 30 Days |
| Previous | Previous Calendar Week, Previous Calendar Month, Previous Calendar Year |
| Custom | Select custom start and end dates |
Each range type can be configured independently. GlamAR saves your last-used configuration for quick access.
Time Grain
Time Grain defines the level of detail used when displaying data in the graph. You can view metrics at different granularities, from seconds and minutes for real-time tracking to days, weeks, or months for broader trend analysis.
Choose the time grain that best matches your selected time range and the level of insight you need. For example:
- Use minute-level grains to analyze short-term performance spikes.
- Use daily or weekly grains to identify ongoing trends.
- Use monthly, quarterly, or yearly grains to review long-term usage patterns.
Available options include common intervals such as second, minute, hour, day, week, month, and quarter, along with finer increments like 5-minute or 15-minute views.
The default time grain adapts automatically to your selected time range but can be changed manually for deeper analysis.
AR Try-on
The AR Try-On in analytics section provides insight into how users interact with your virtual try-on experiences.
It highlights engagement, platform distribution, conversion intent, and system performance through a set of summary cards and detailed tables.
Users can also select a time range to view analytics for a specific period. For more details, refer to the Time Range section in Plans.
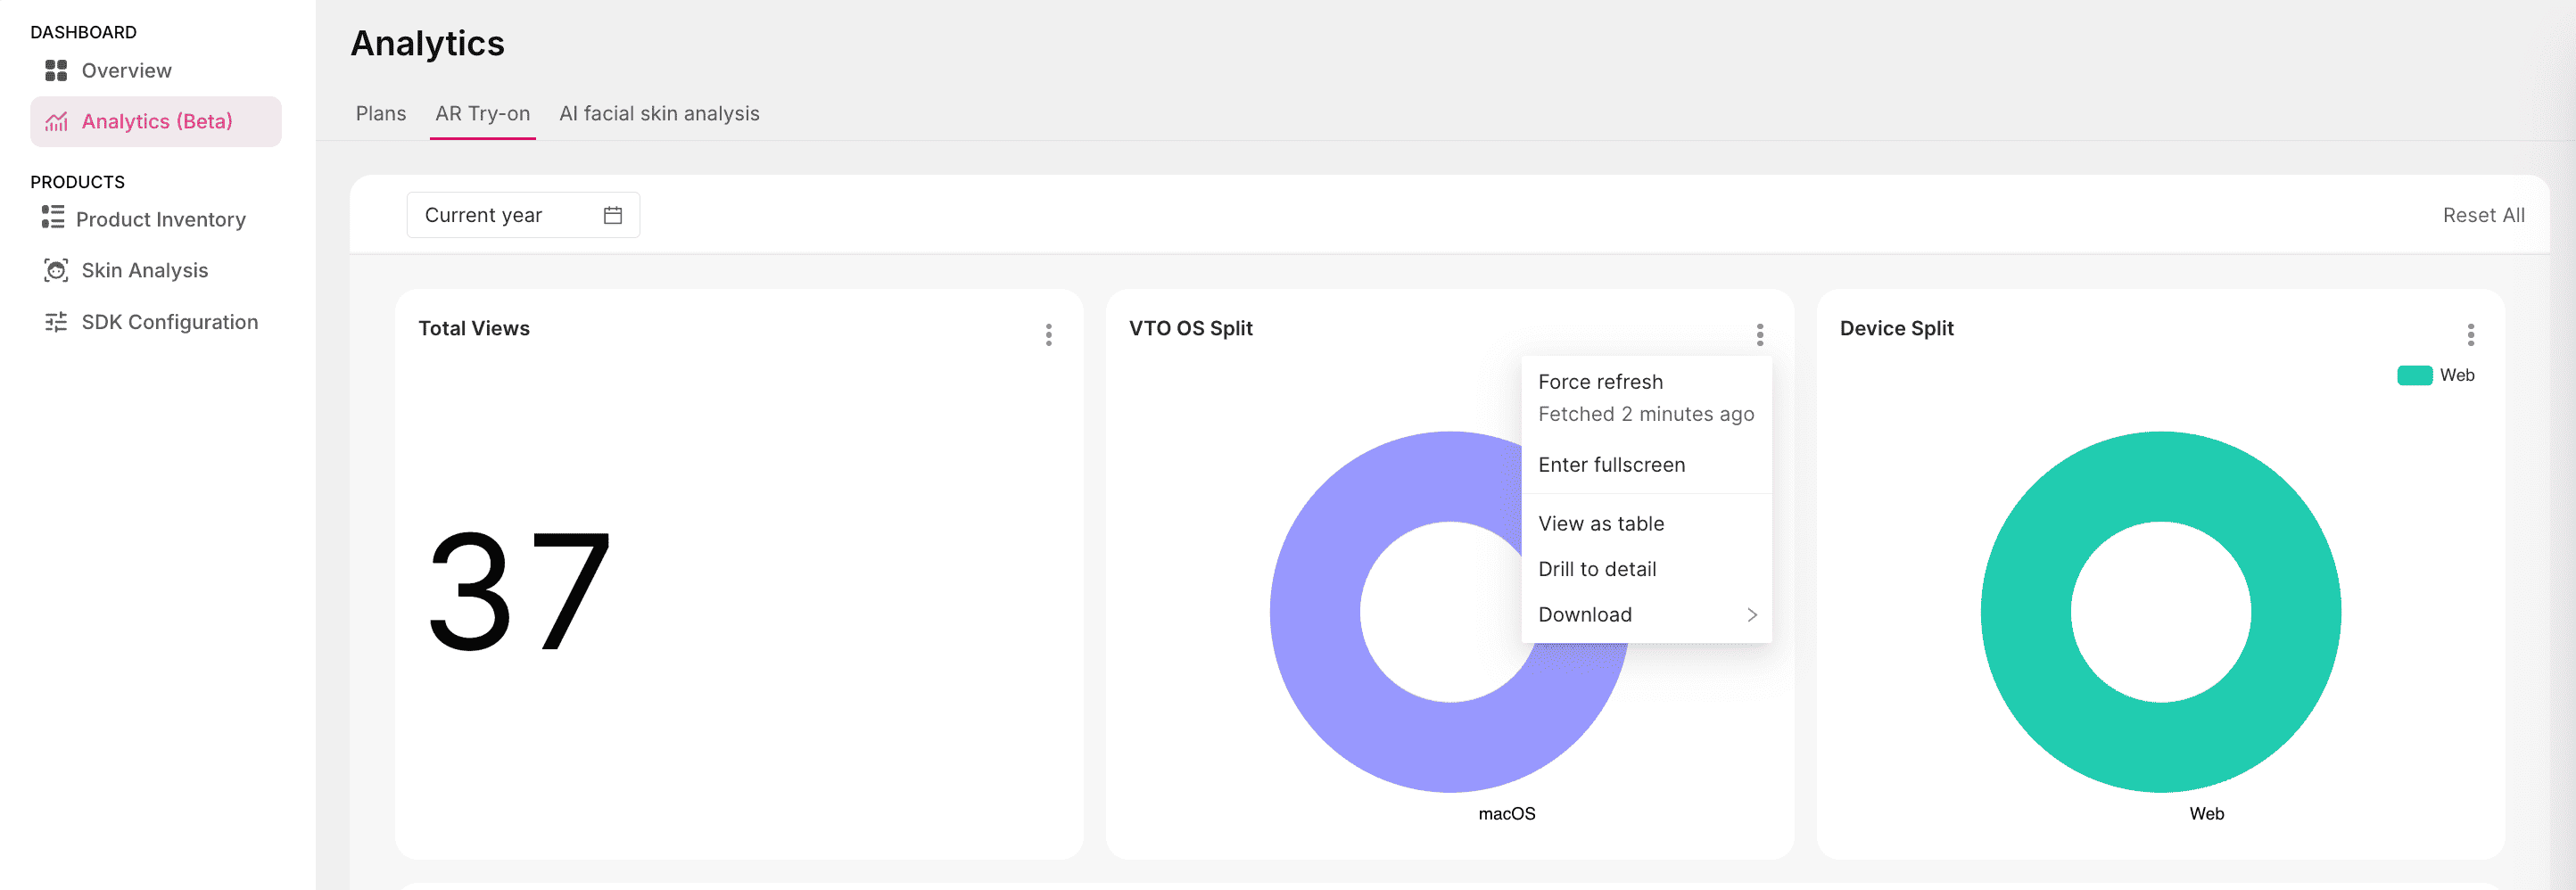
Overview Cards
At the top of the dashboard, three cards display key usage metrics:
- Total Views: Shows the total number of product views through AR Try-On. Each time a user launches a try-on session, it counts as one view. This helps measure the overall engagement volume for AR-enabled products.
- VTO OS Split: Displays a percentage breakdown of the operating systems from which AR Try-On was accessed, such as Windows, macOS, or Linux. This helps you identify which environments your customers are using most and optimize performance accordingly.
- Device Split: Indicates the platform used to access AR Try-On, such as Web, iOS, or Android. This split helps evaluate whether your users primarily interact through mobile apps or web browsers and informs device-specific experience improvements.
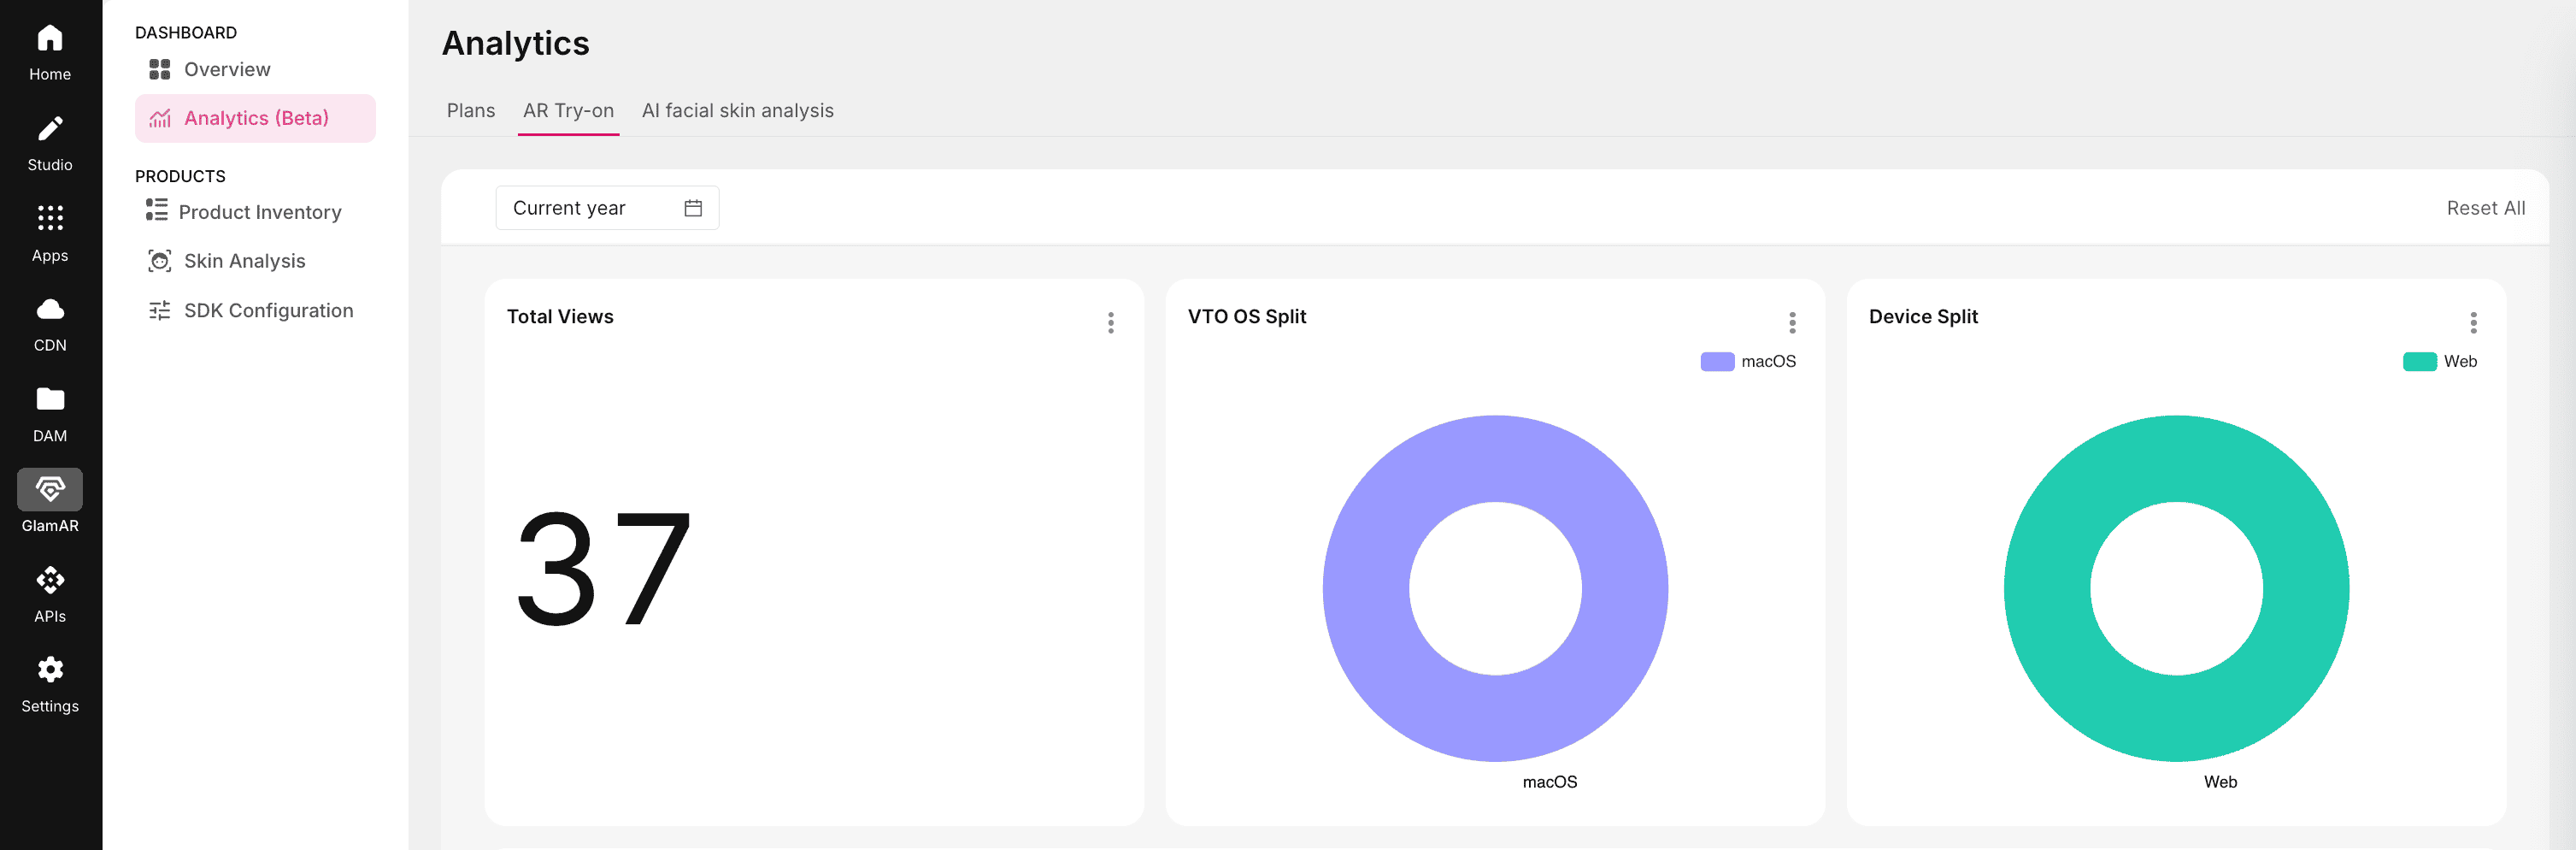
Each card gives a quick snapshot of engagement and technical reach across devices and platforms.
Product-Wise Add to Cart
This table provides a product-level breakdown of how many times users clicked the Add to Cart button after using AR Try-On.
It helps track how virtual try-ons contribute to shopping intent and conversion performance.
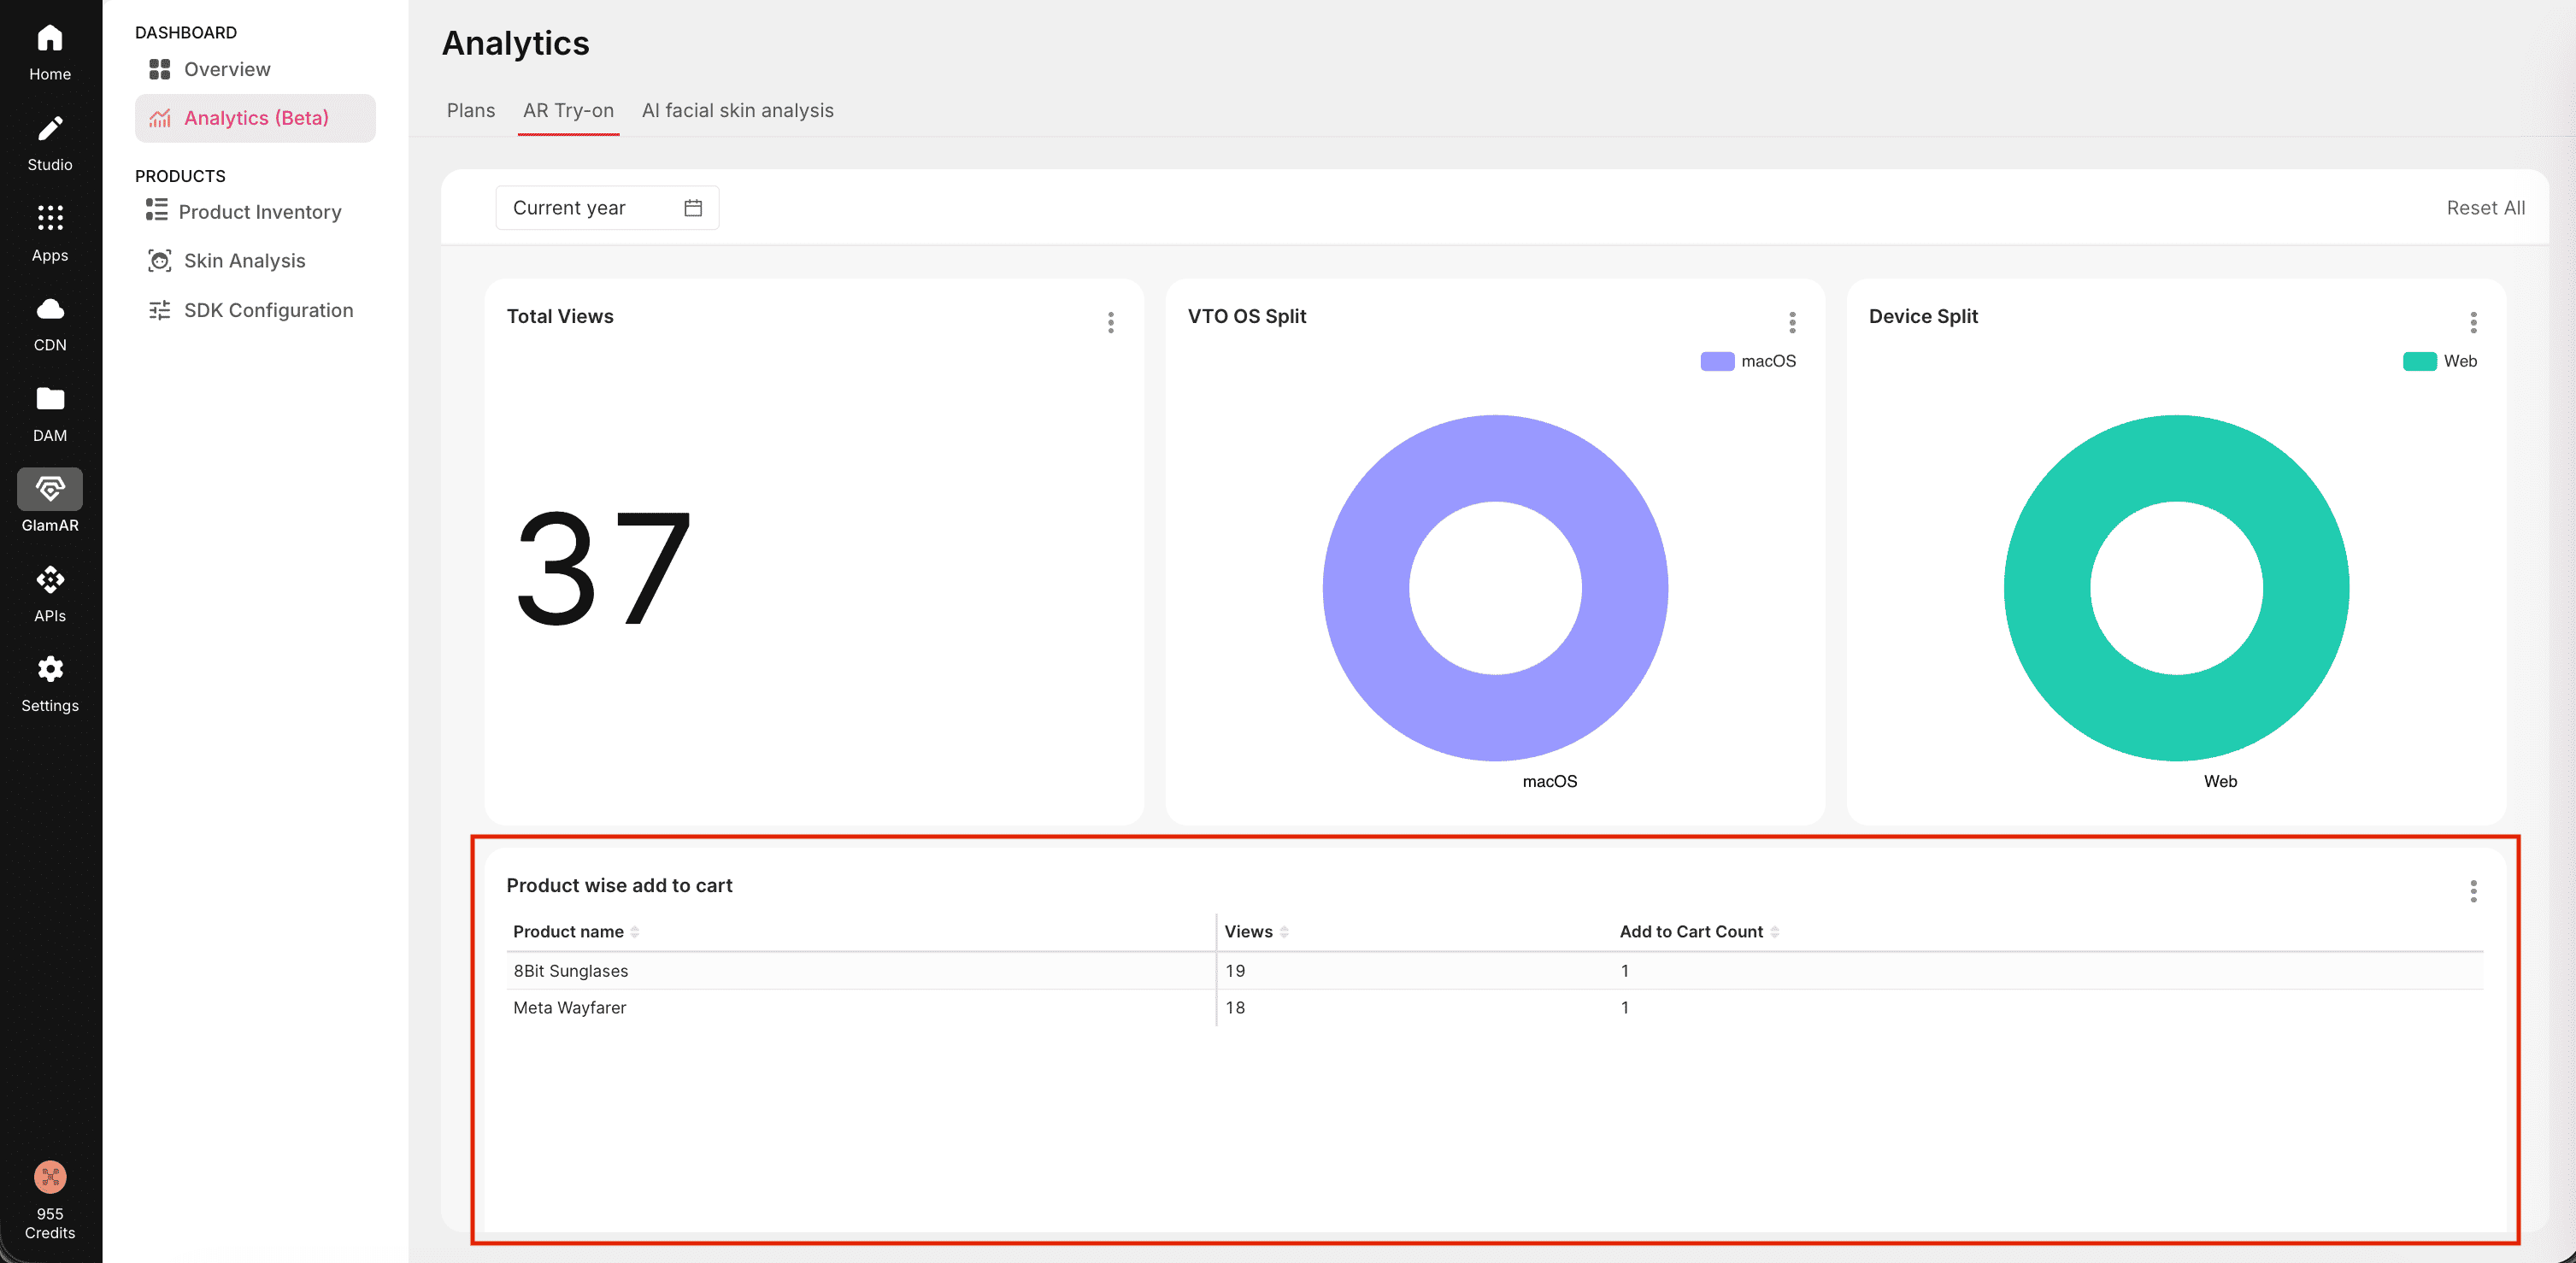
- Views represent the number of try-on sessions initiated for a product.
- Add to Cart Count reflects how many of those sessions led to an Add to Cart action.
Reviewing this table regularly helps you identify high-performing products and those that may need visual improvements or placement optimization in the catalog.
Error Types Count
The Error Types Count table lists the technical issues encountered during AR Try-On sessions.
It helps diagnose and address recurring problems that could affect usability or conversion rates.
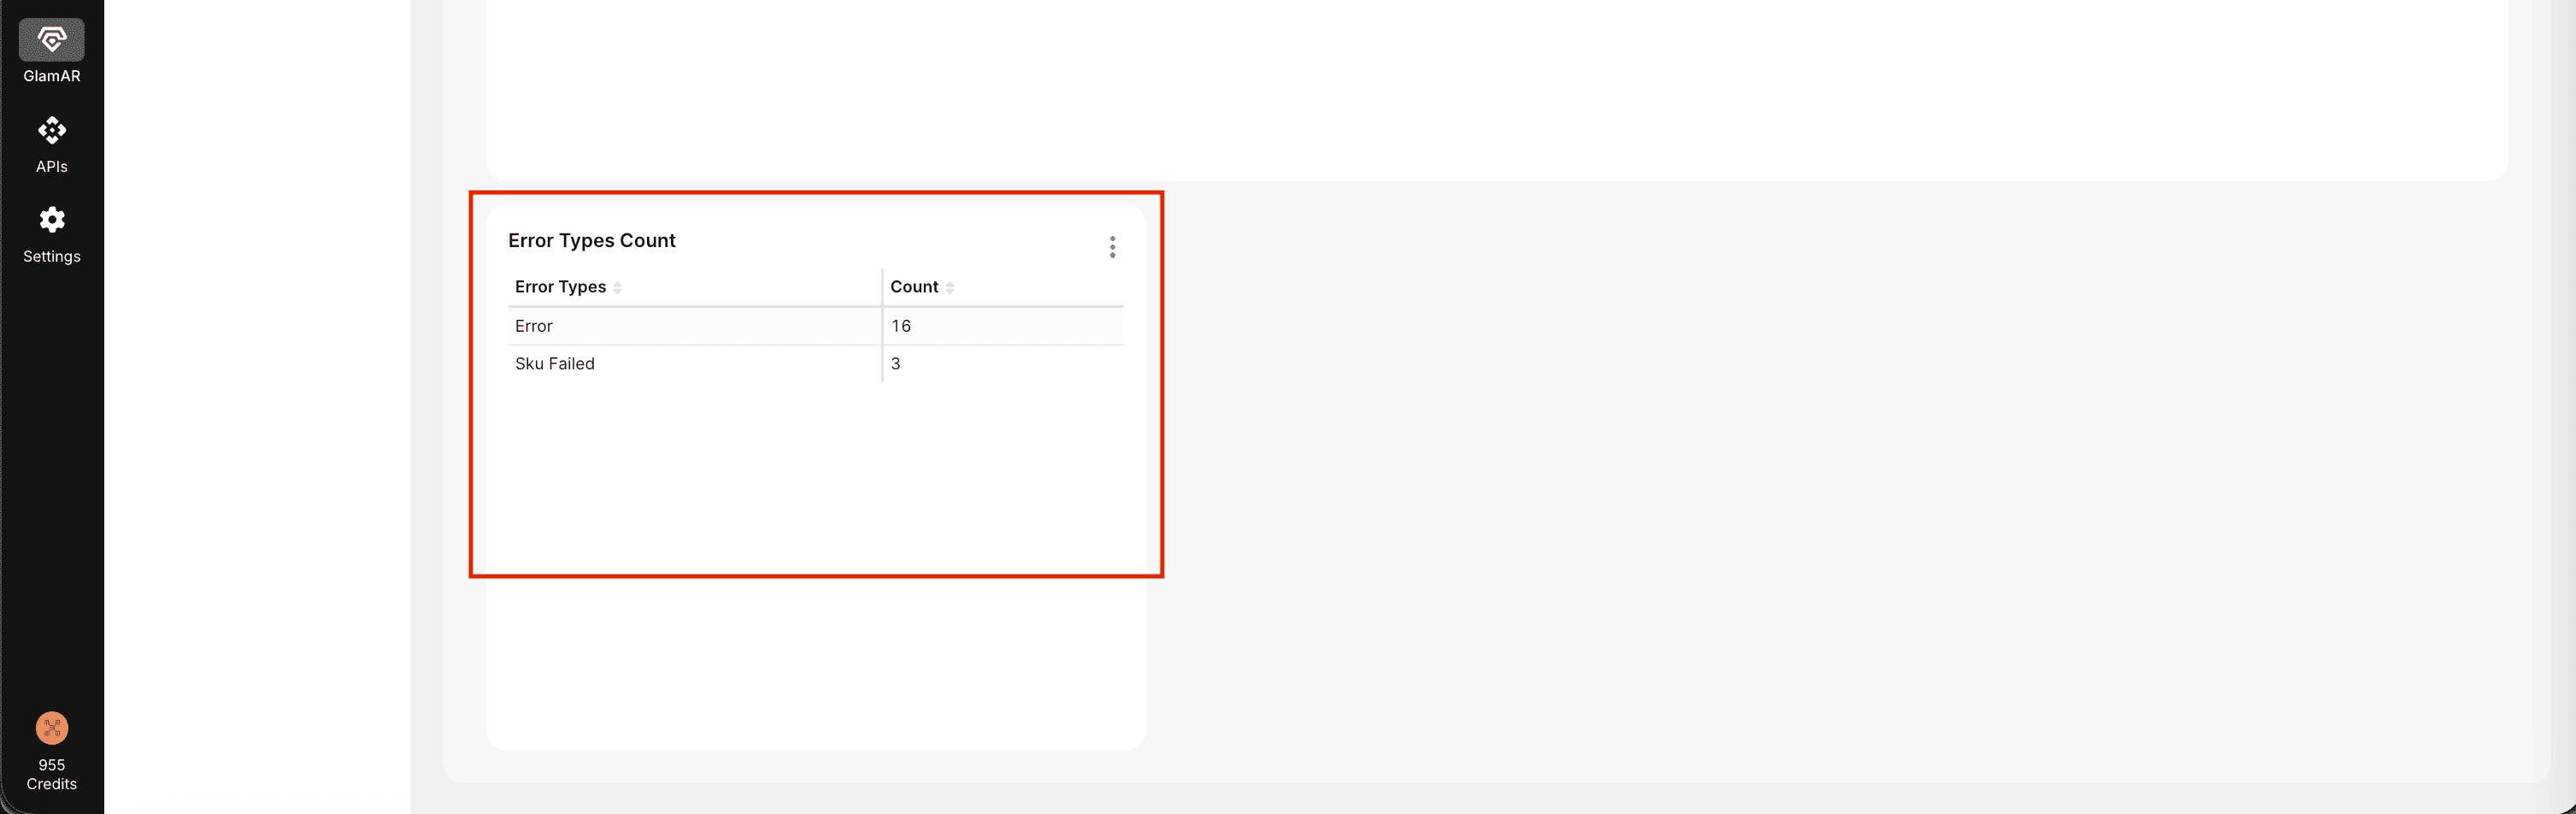
Monitoring this data helps maintain a stable and reliable AR Try-On experience across all supported devices and platforms.
Options
Every card includes a three-dot options menu that gives users control over how data is displayed and accessed.
- Force Refresh: Updates the data instantly, ensuring that metrics reflect the most recent activity.
- Enter Full Screen: Expands the view for a clearer and more focused display, useful for presentations or detailed reviews.
- View as Table: Converts the graph or chart into a data table, allowing you to see exact numbers instead of visual aggregates.
- Drill to Detail: Opens a detailed tabular report for that metric, showing granular data by product, device, or session.
- Download: Exports the data for external analysis or reporting. Supported formats include CSV, Excel, and Image.
These options give teams flexibility in how they explore, share, and act on their analytics data.