Analytics
The AI Facial Skin Analysis in analytics section provides detailed insights into how users interact with GlamAR’s AI based facial skin analysis. It helps you understand scan activity, user demographics, and diagnostic patterns, and gives a data-driven view of how the feature performs across applications.
Analytics are displayed based on the Application ID. Each created app has its own Application ID listed at the top of the dashboard. Select the application you want to analyze from the list to view its associated data.

Users can also select a time range to view analytics for a specific period. For more details, refer to the Time Range section in Plans.
Overview Cards
On the dashboard, five cards display high-level metrics related to skin analysis usage and distribution. These cards update automatically when you change the selected application or time range.
- Total Skin Analysis Scans: Displays the total number of scans performed within the selected time period. This metric gives a quick view of how frequently users are engaging with the skin analysis feature.
- Skin Type Breakdown: Shows the distribution of detected skin types, such as Oily, Dry, Normal, or Combination. This helps identify the diversity of user skin profiles.
- Skin Tone Breakdown: Visualizes the proportion of different skin tones detected across scans. Understanding tone distribution helps ensure inclusivity and dataset accuracy.
- Skin Analysis OS Split: Indicates which operating systems users used to run the analysis, such as Windows, macOS, or Android.
- Skin Analysis Device Count: Displays the number and type of devices used for scans, helping track whether users primarily access the feature via mobile or web.

Together, these cards provide a complete overview of scan frequency, audience diversity, and technical reach.
Skin Analysis Report Summary
The Skin Analysis Report Summary table is generated after each skin analysis scan. It provides detailed diagnostic results and scores for key skin concerns, helping evaluate overall skin health and condition severity.
- Concerns: The detected skin conditions analyzed during each scan, such as Hydration, Pigmentation, Pores, Eye Bags, etc..
- Top Concern (Score): The concern with the lowest or most critical score from the analysis, indicating the primary area for improvement.
- Good / Average / Bad: Categorizes scan results based on their scoring ranges.
- Average Score: Represents the mean score for each concern, summarizing the user’s overall skin condition.
This table serves as the final diagnostic output of the skin analysis, summarizing condition-specific scores and overall assessment quality.
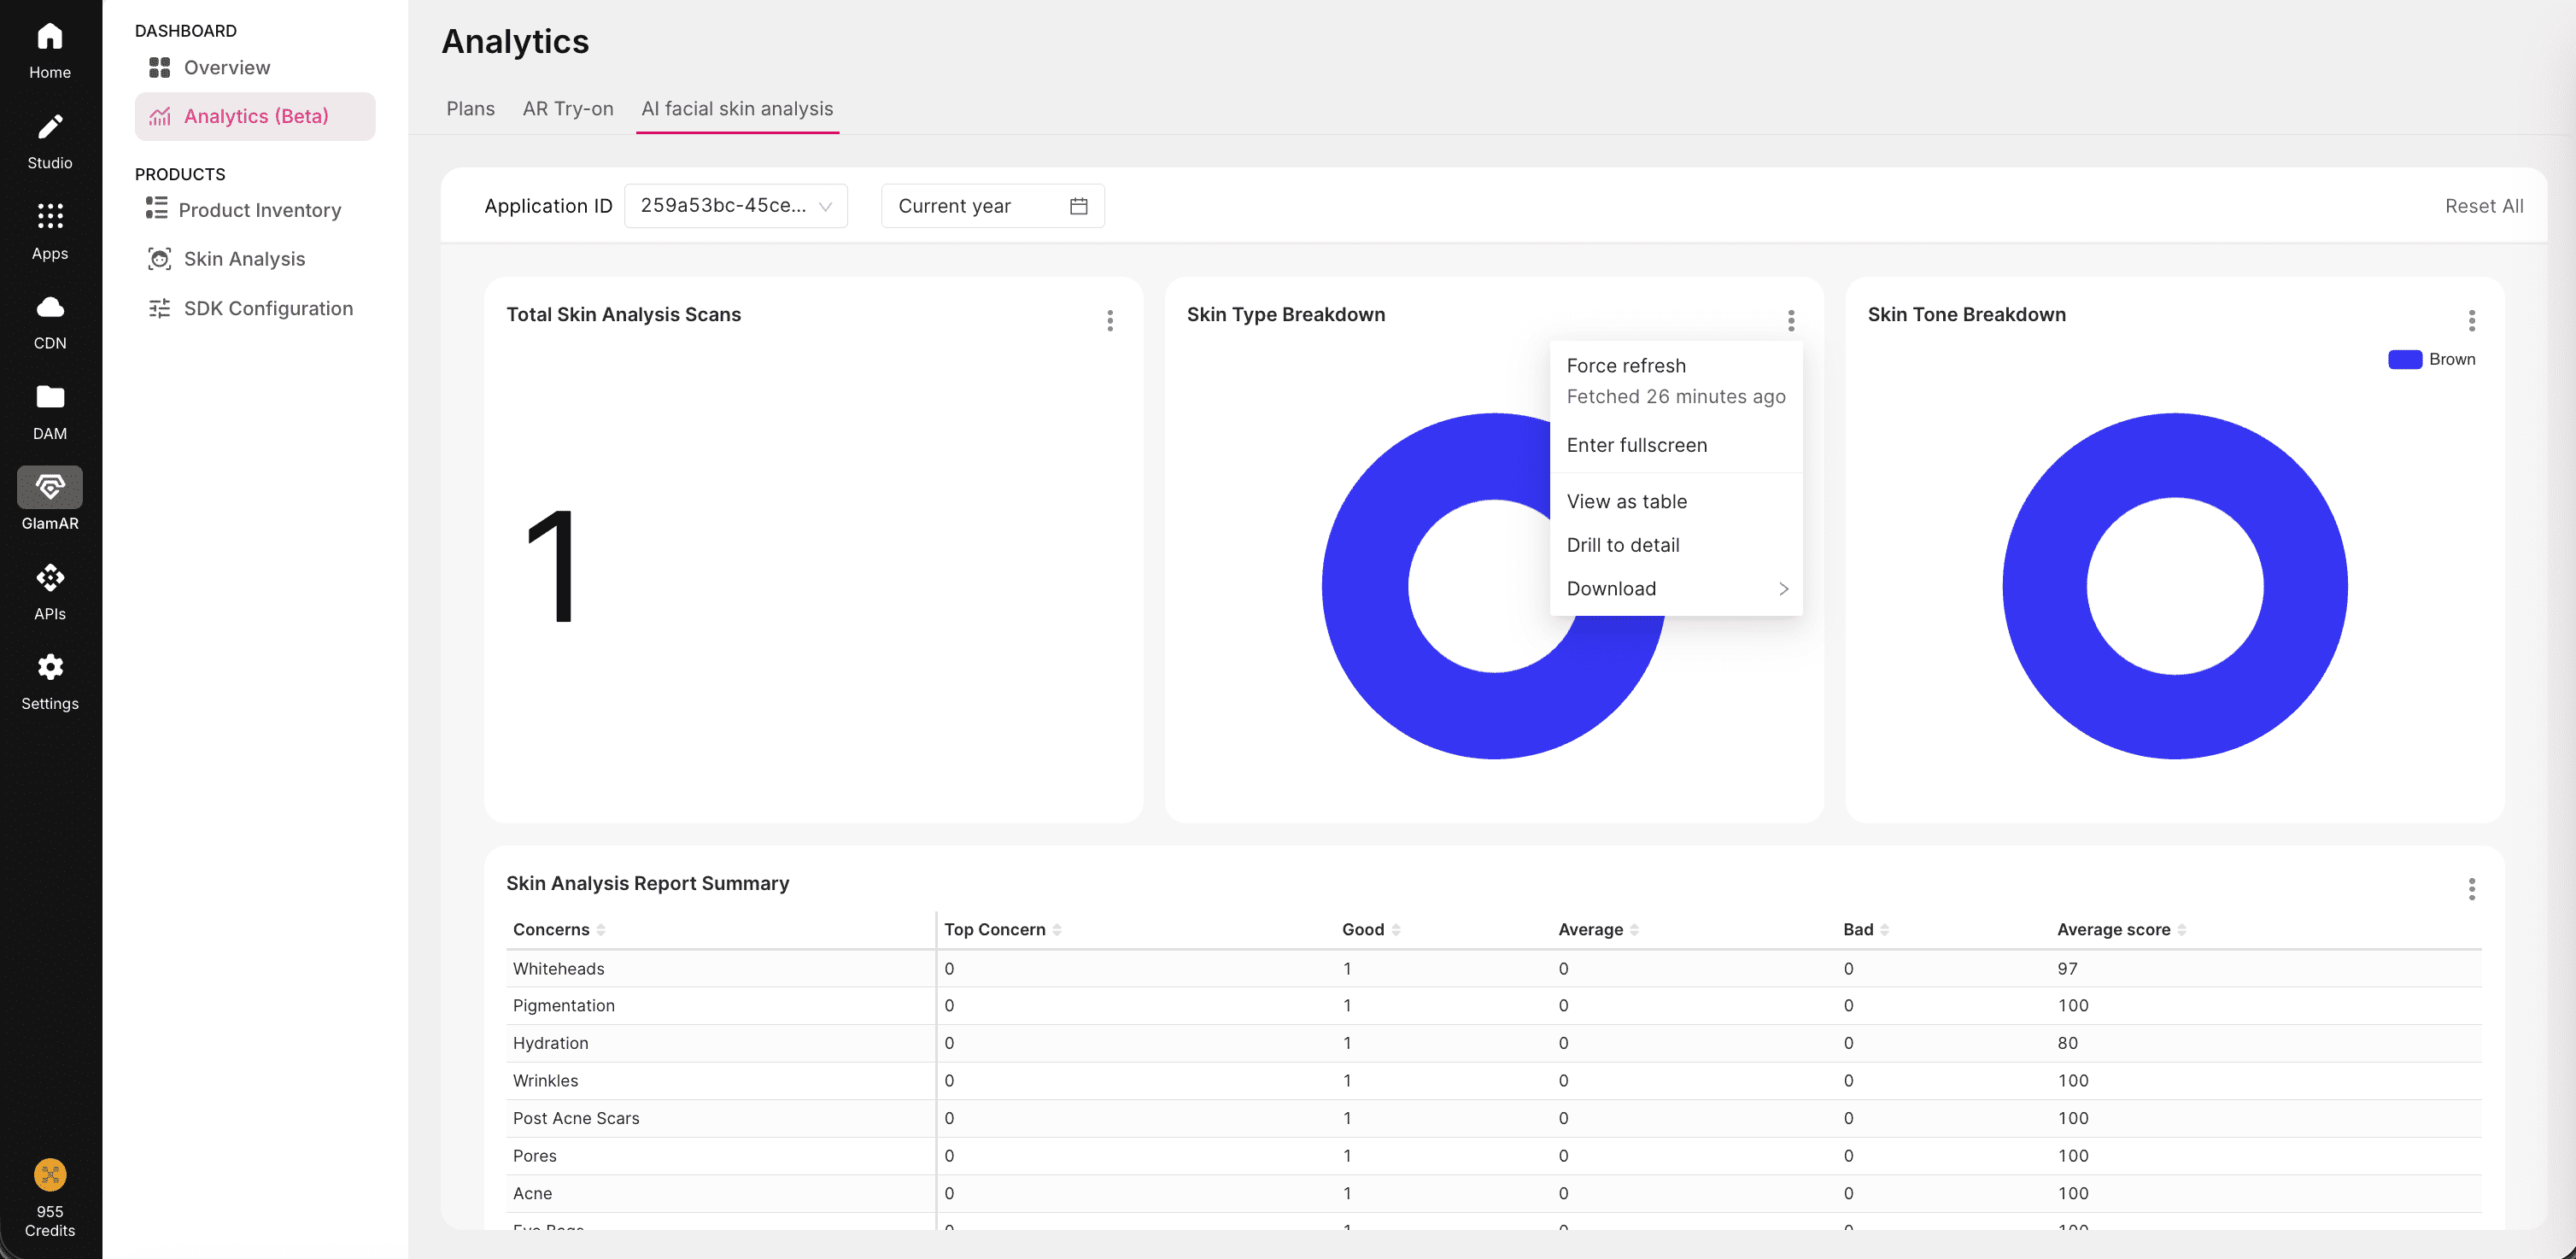
Options
Each card includes a three-dot options menu that gives users control over how analytics are displayed or exported:
- Force Refresh: Updates the data instantly, ensuring that metrics reflect the most recent activity.
- Enter Full Screen: Expands the view for a clearer and more focused display, useful for presentations or detailed reviews.
- View as Table: Converts the graph or chart into a data table, allowing you to see exact numbers instead of visual aggregates.
- Drill to Detail: Opens a detailed tabular report for that metric, showing granular data by product, device, or session.
- Download: Exports the data for external analysis or reporting. Supported formats include CSV, Excel, and Image.
These options make it easy to review performance data, prepare reports, or analyze trends externally.